Step 3: Create a dashboard
In the previous steps we did an exploratory analysis that gave us the opportunity to learn about the data and what we could extract from it. After that we learnt to automate the data ingestion, that is the process of gathering and processing the data though in a scheduled way.
So now, we have our ready to use dataset which is automatically updated. The last step on the process is to create a beautiful dashboard that we can share with the decission makers to help them to take the organization to the next level thanks to the use of data informed decissions.
In magasin’s open source architecture, Apache Superset is the business intelligence dashboarding tool that comes out of the box, but similarly to what we mentioned about MinIO, the loosely coupled architecture of magasin allows organizations to choose to leverage other tools that the organization may be already using such as PowerBI or Tableau.
Apache Superset can consume any SQL based database engine. However, we stored our data as .parquet files. To allow us to use file based datasets in the architecture we have Apache Drill, which basically allows us to consume these datasets using a SQL interface. Indeed, you can also query other formats such as CSV or JSON and Apache Drill will provide a SQL interface to query them.
1 Setup Apache Drill to connect to MinIO
Launch Apache Drill User interface
mag drill ui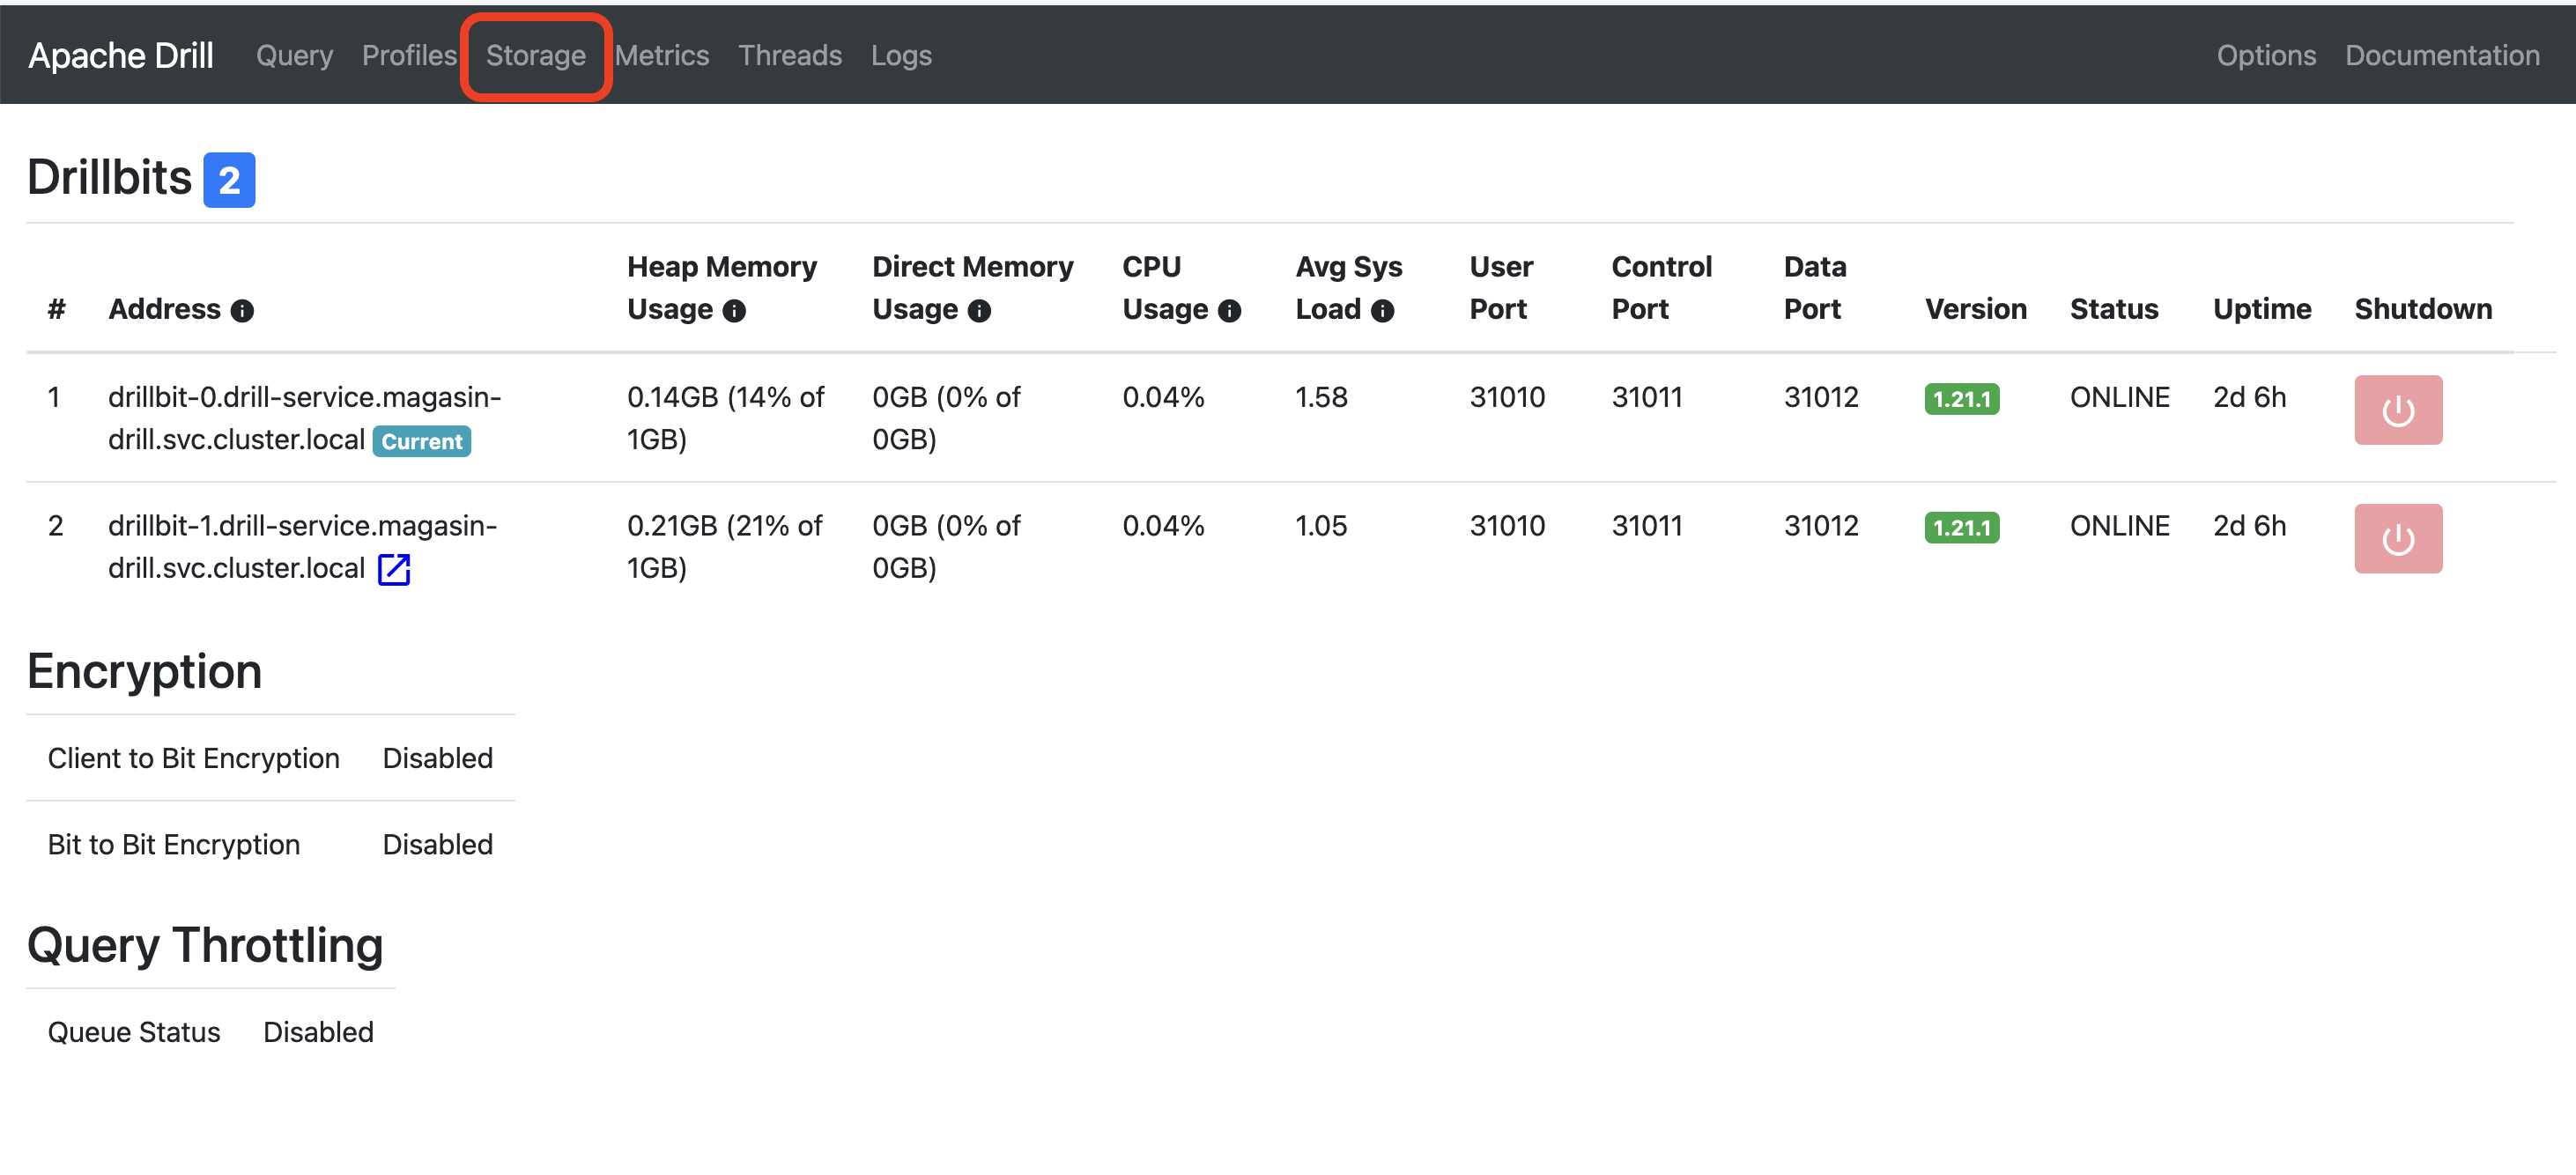
Drill user interface home
Then in the “Storage” page within the “Disabled Storage Plugins” click on the Update button of S3.
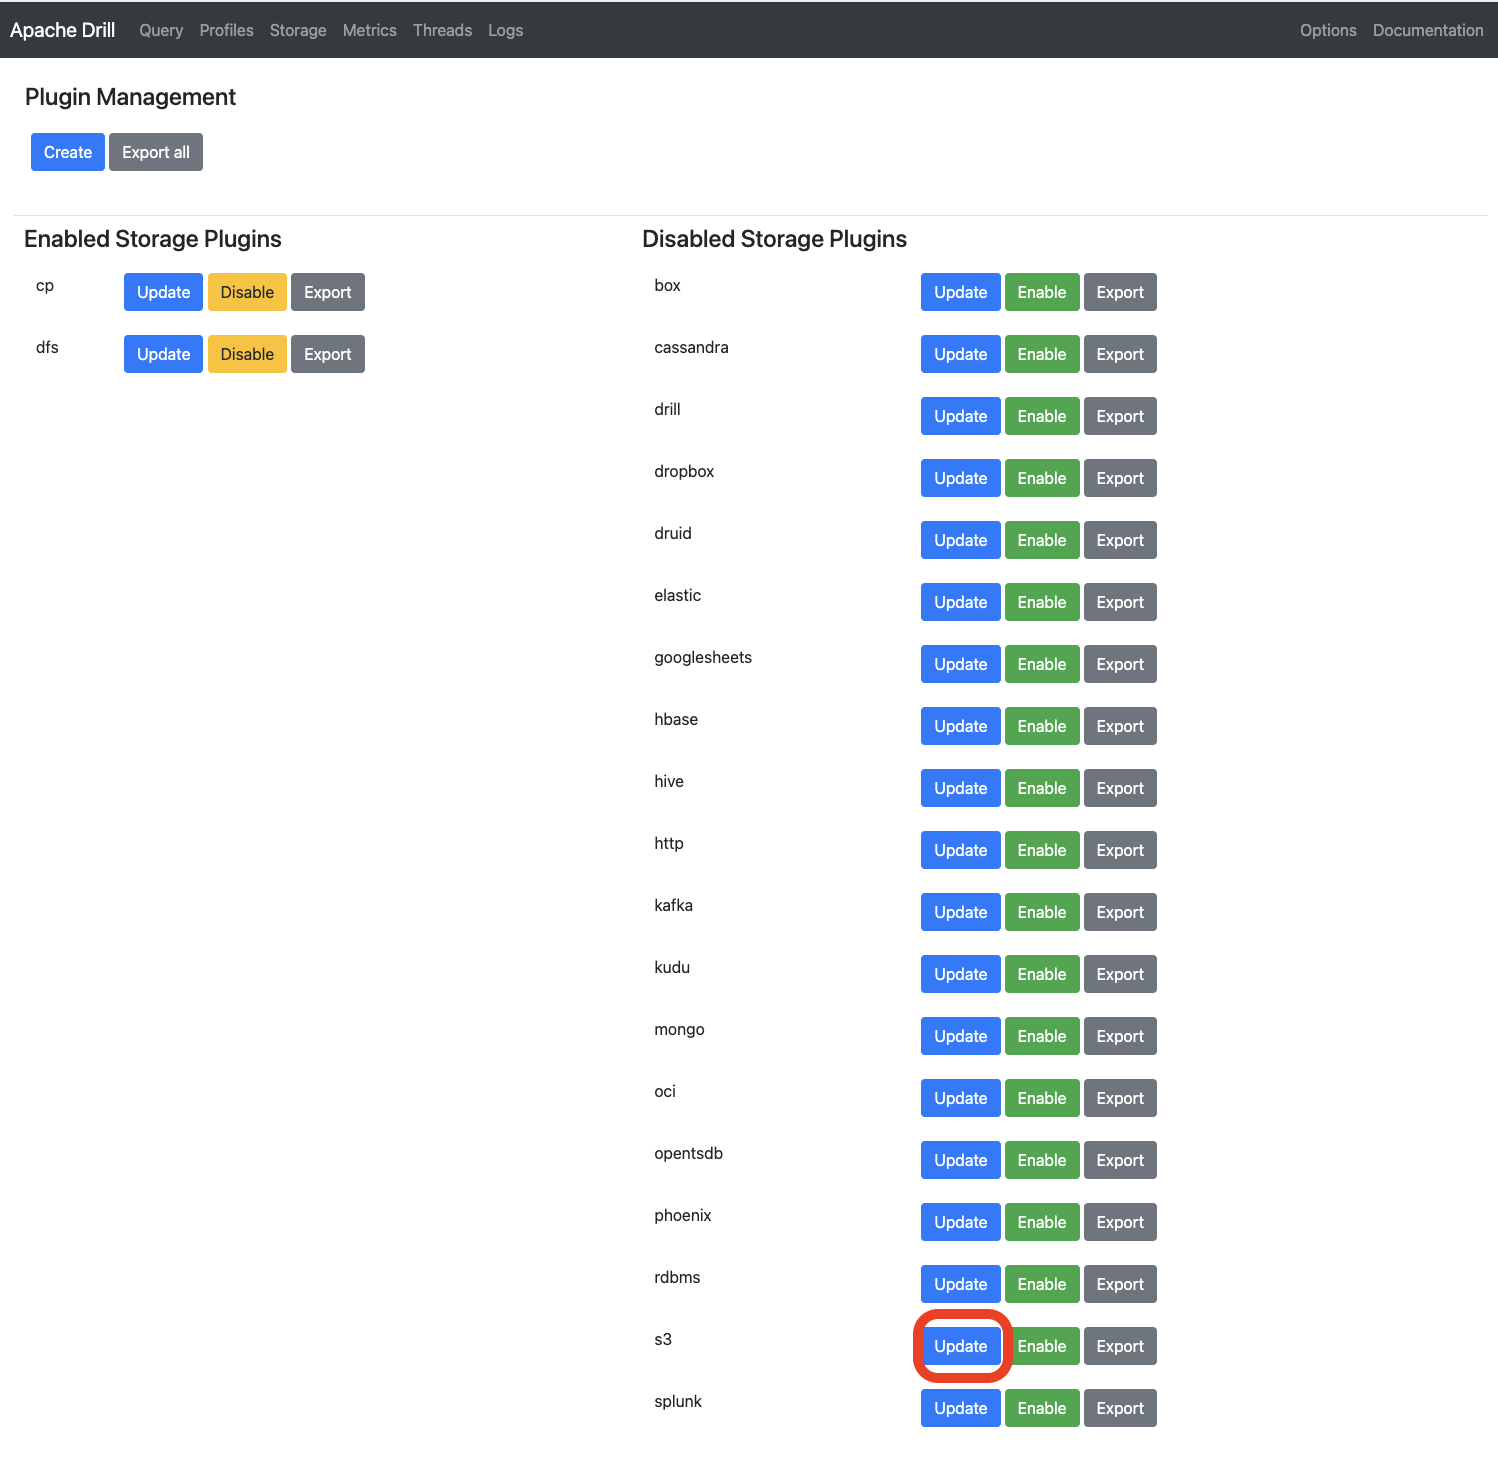
Modify the beggining of the JSON so it looks like:
{
  "type": "file",
  "connection": "s3a://magasin",
  "config": {
    "fs.s3a.connection.ssl.enabled": "false",
    "fs.s3a.path.style.access": "true",
    "fs.s3a.endpoint": "myminio-hl.magasin-tenant.svc.cluster.local:9000",
    "fs.s3a.access.key": "minio",
    "fs.s3a.secret.key": "minio123"
  },
  "workspaces": {
    "data": {
      "location": "/data",
      "writable": false,
      "defaultInputFormat": null,
      "allowAccessOutsideWorkspace": false
    },
    "root": {
      "location": "/",
      "writable": false,
      "defaultInputFormat": null,
      "allowAccessOutsideWorkspace": false
    }
  },
  "formats": {
    # ...
    # KEEP THE REST OF THE FILE SAME AS THE ORIGINAL.
    # ...
  }
}
Press Update button, and then the click on the Enable button.
Now, click on Query at the top navigation bar corner and submit this test query:
USE `s3`.`data`;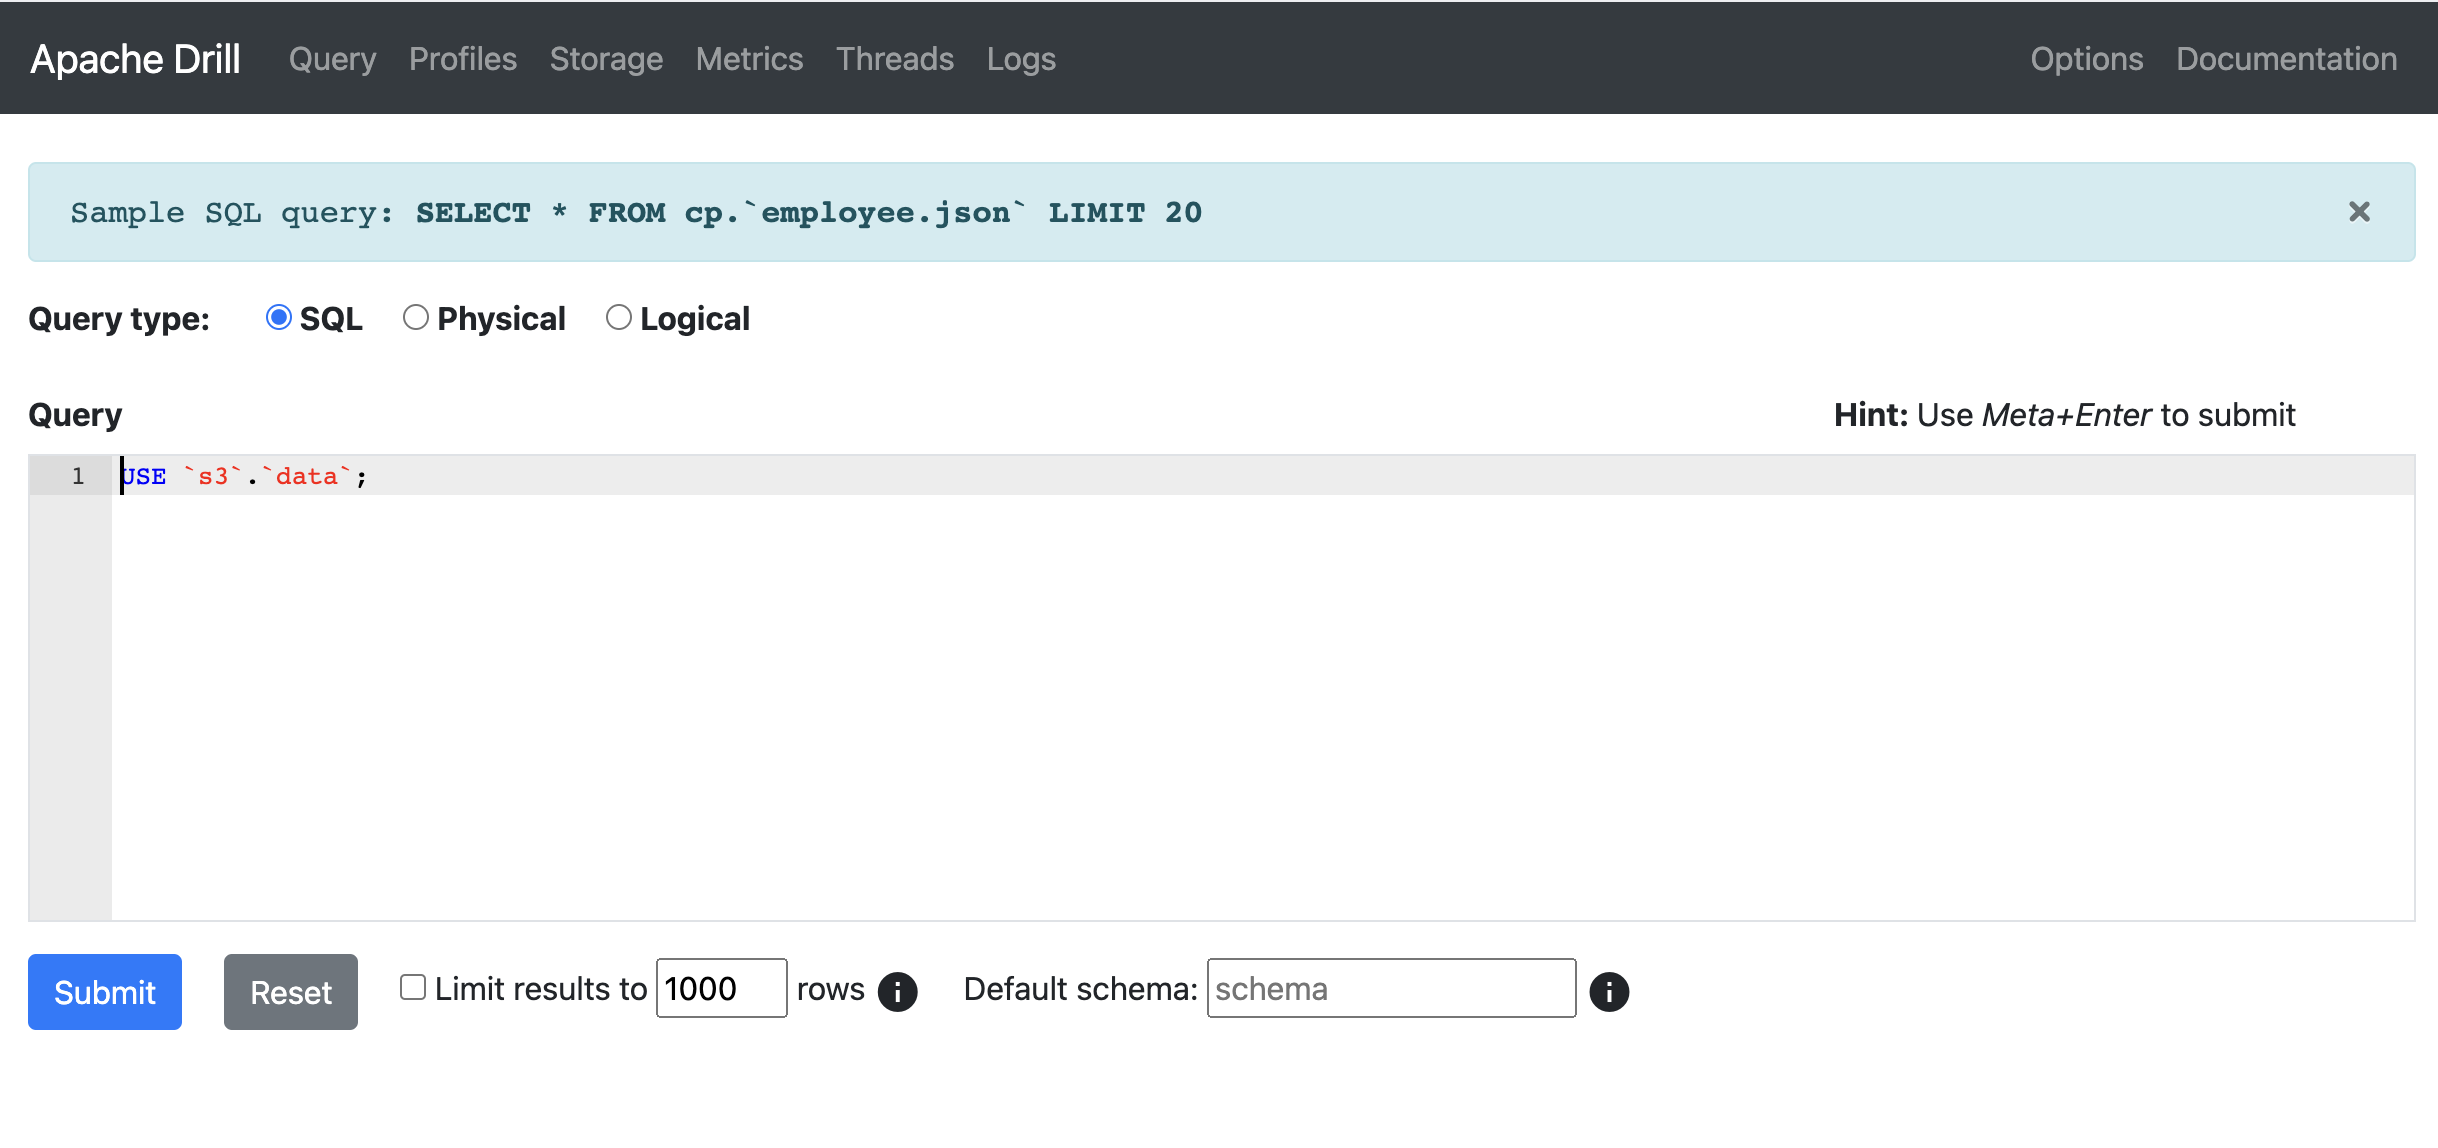
If every thing goes right, you should see something like:

2 Setting up the Drill-Superset database connection
Lauch the Apache Superset user interface
mag superset uiAs credentials, enter
admin/admin
Superset login page: .
Go to top right corner and go to Settings > Database connections
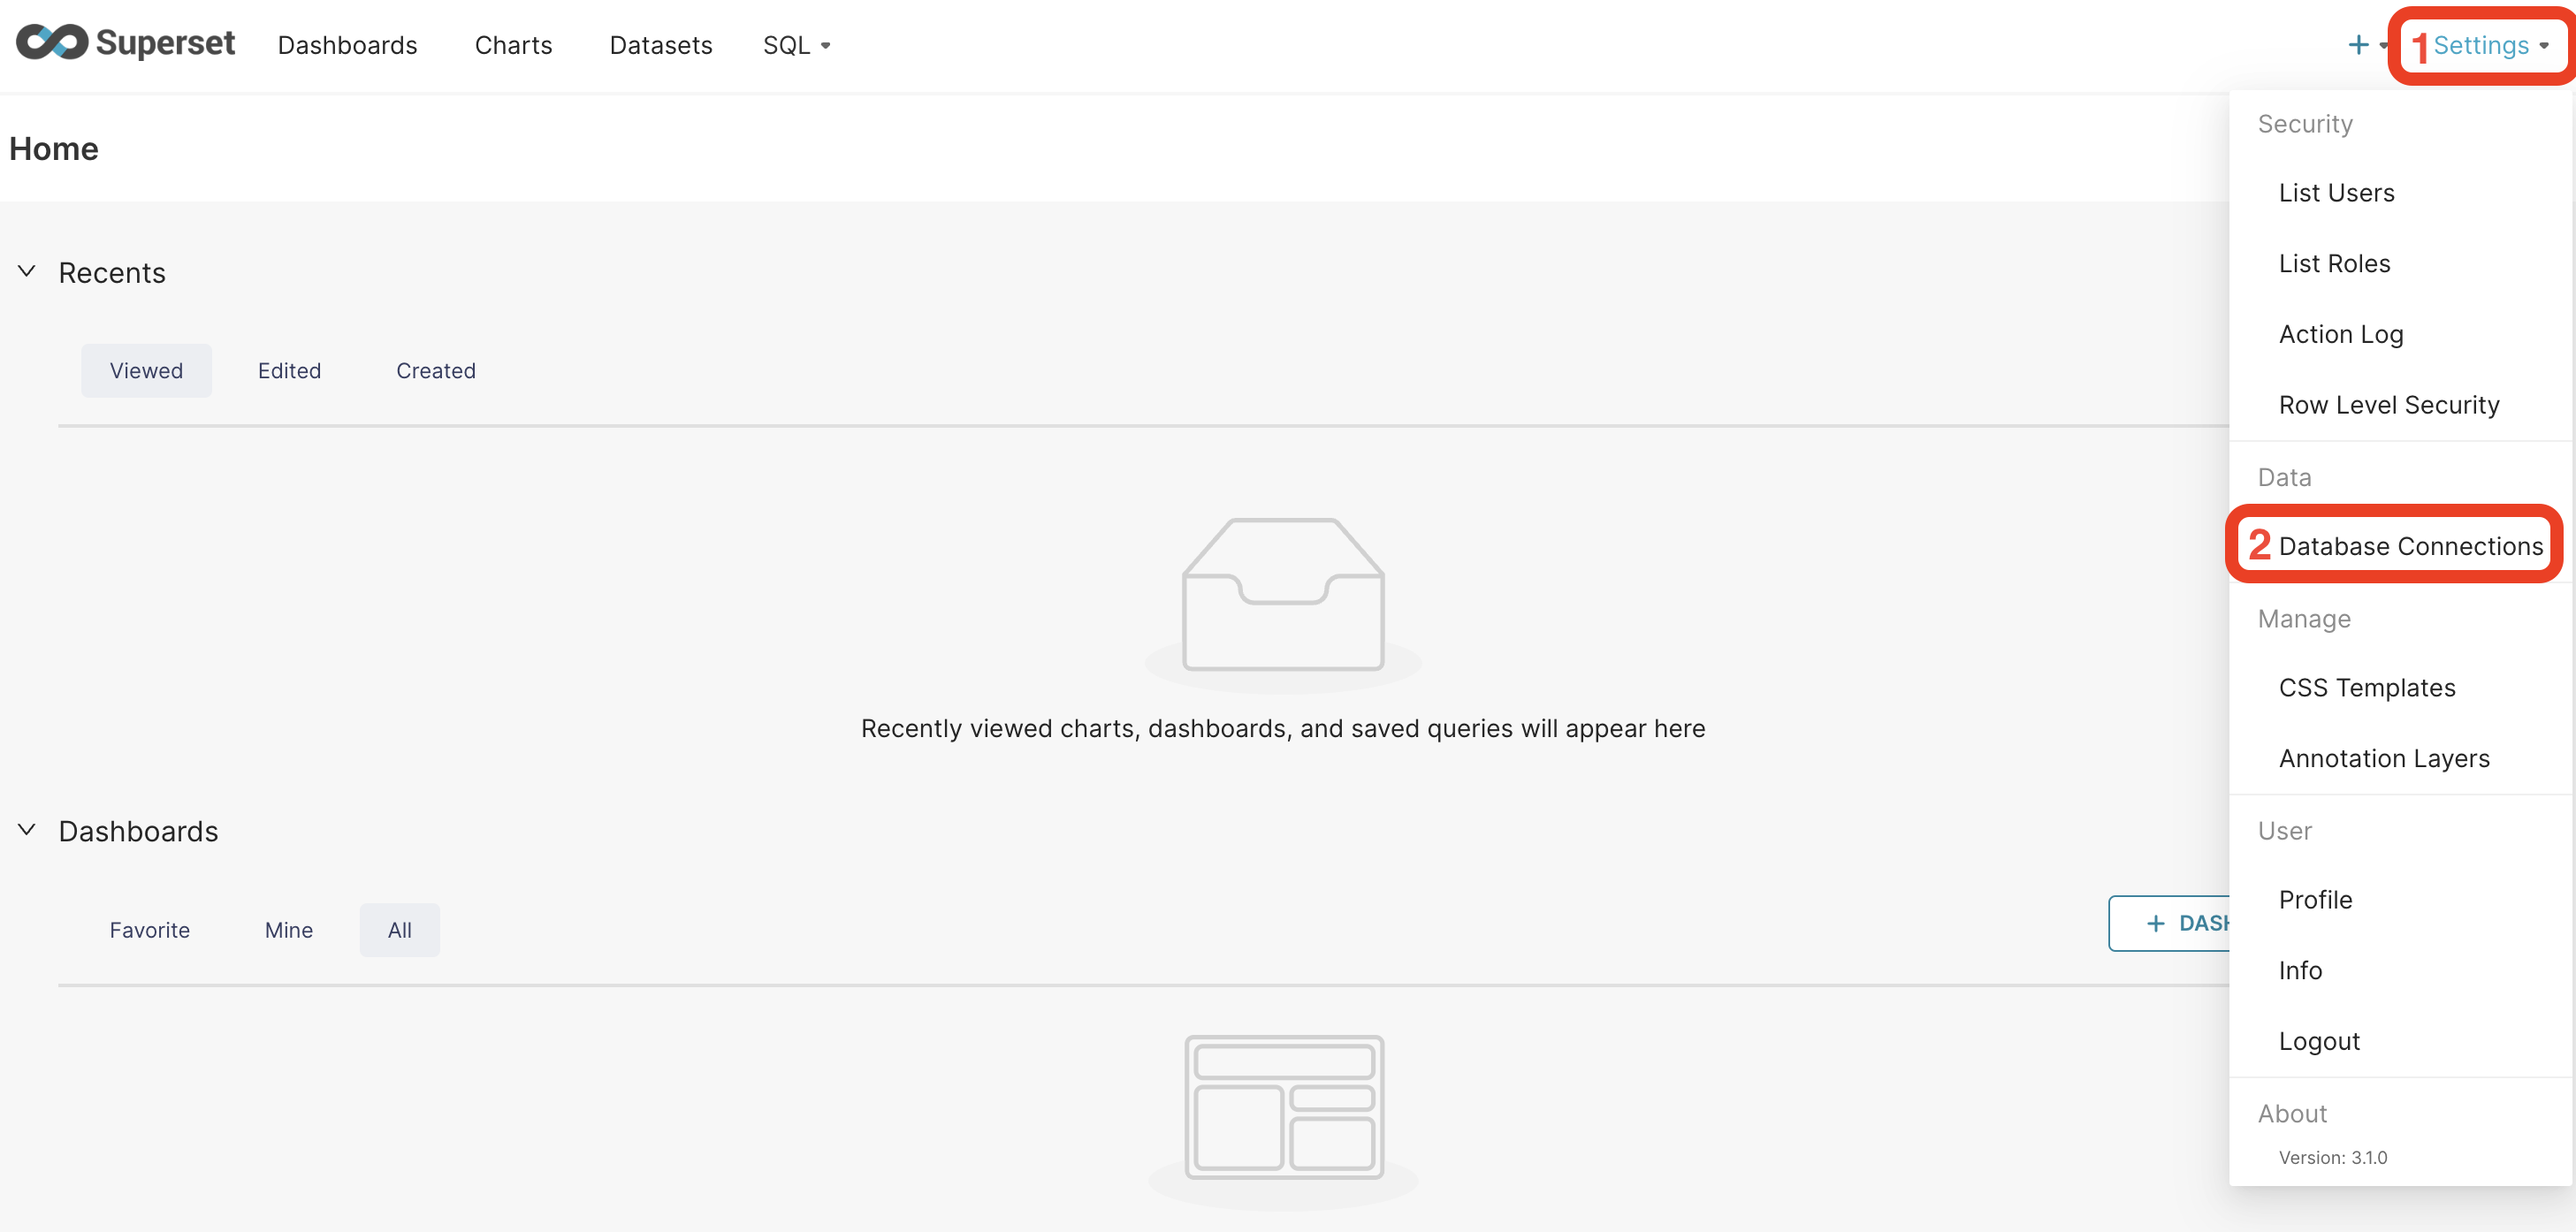 .
.Click on the + Database > Select Apache Drill as database
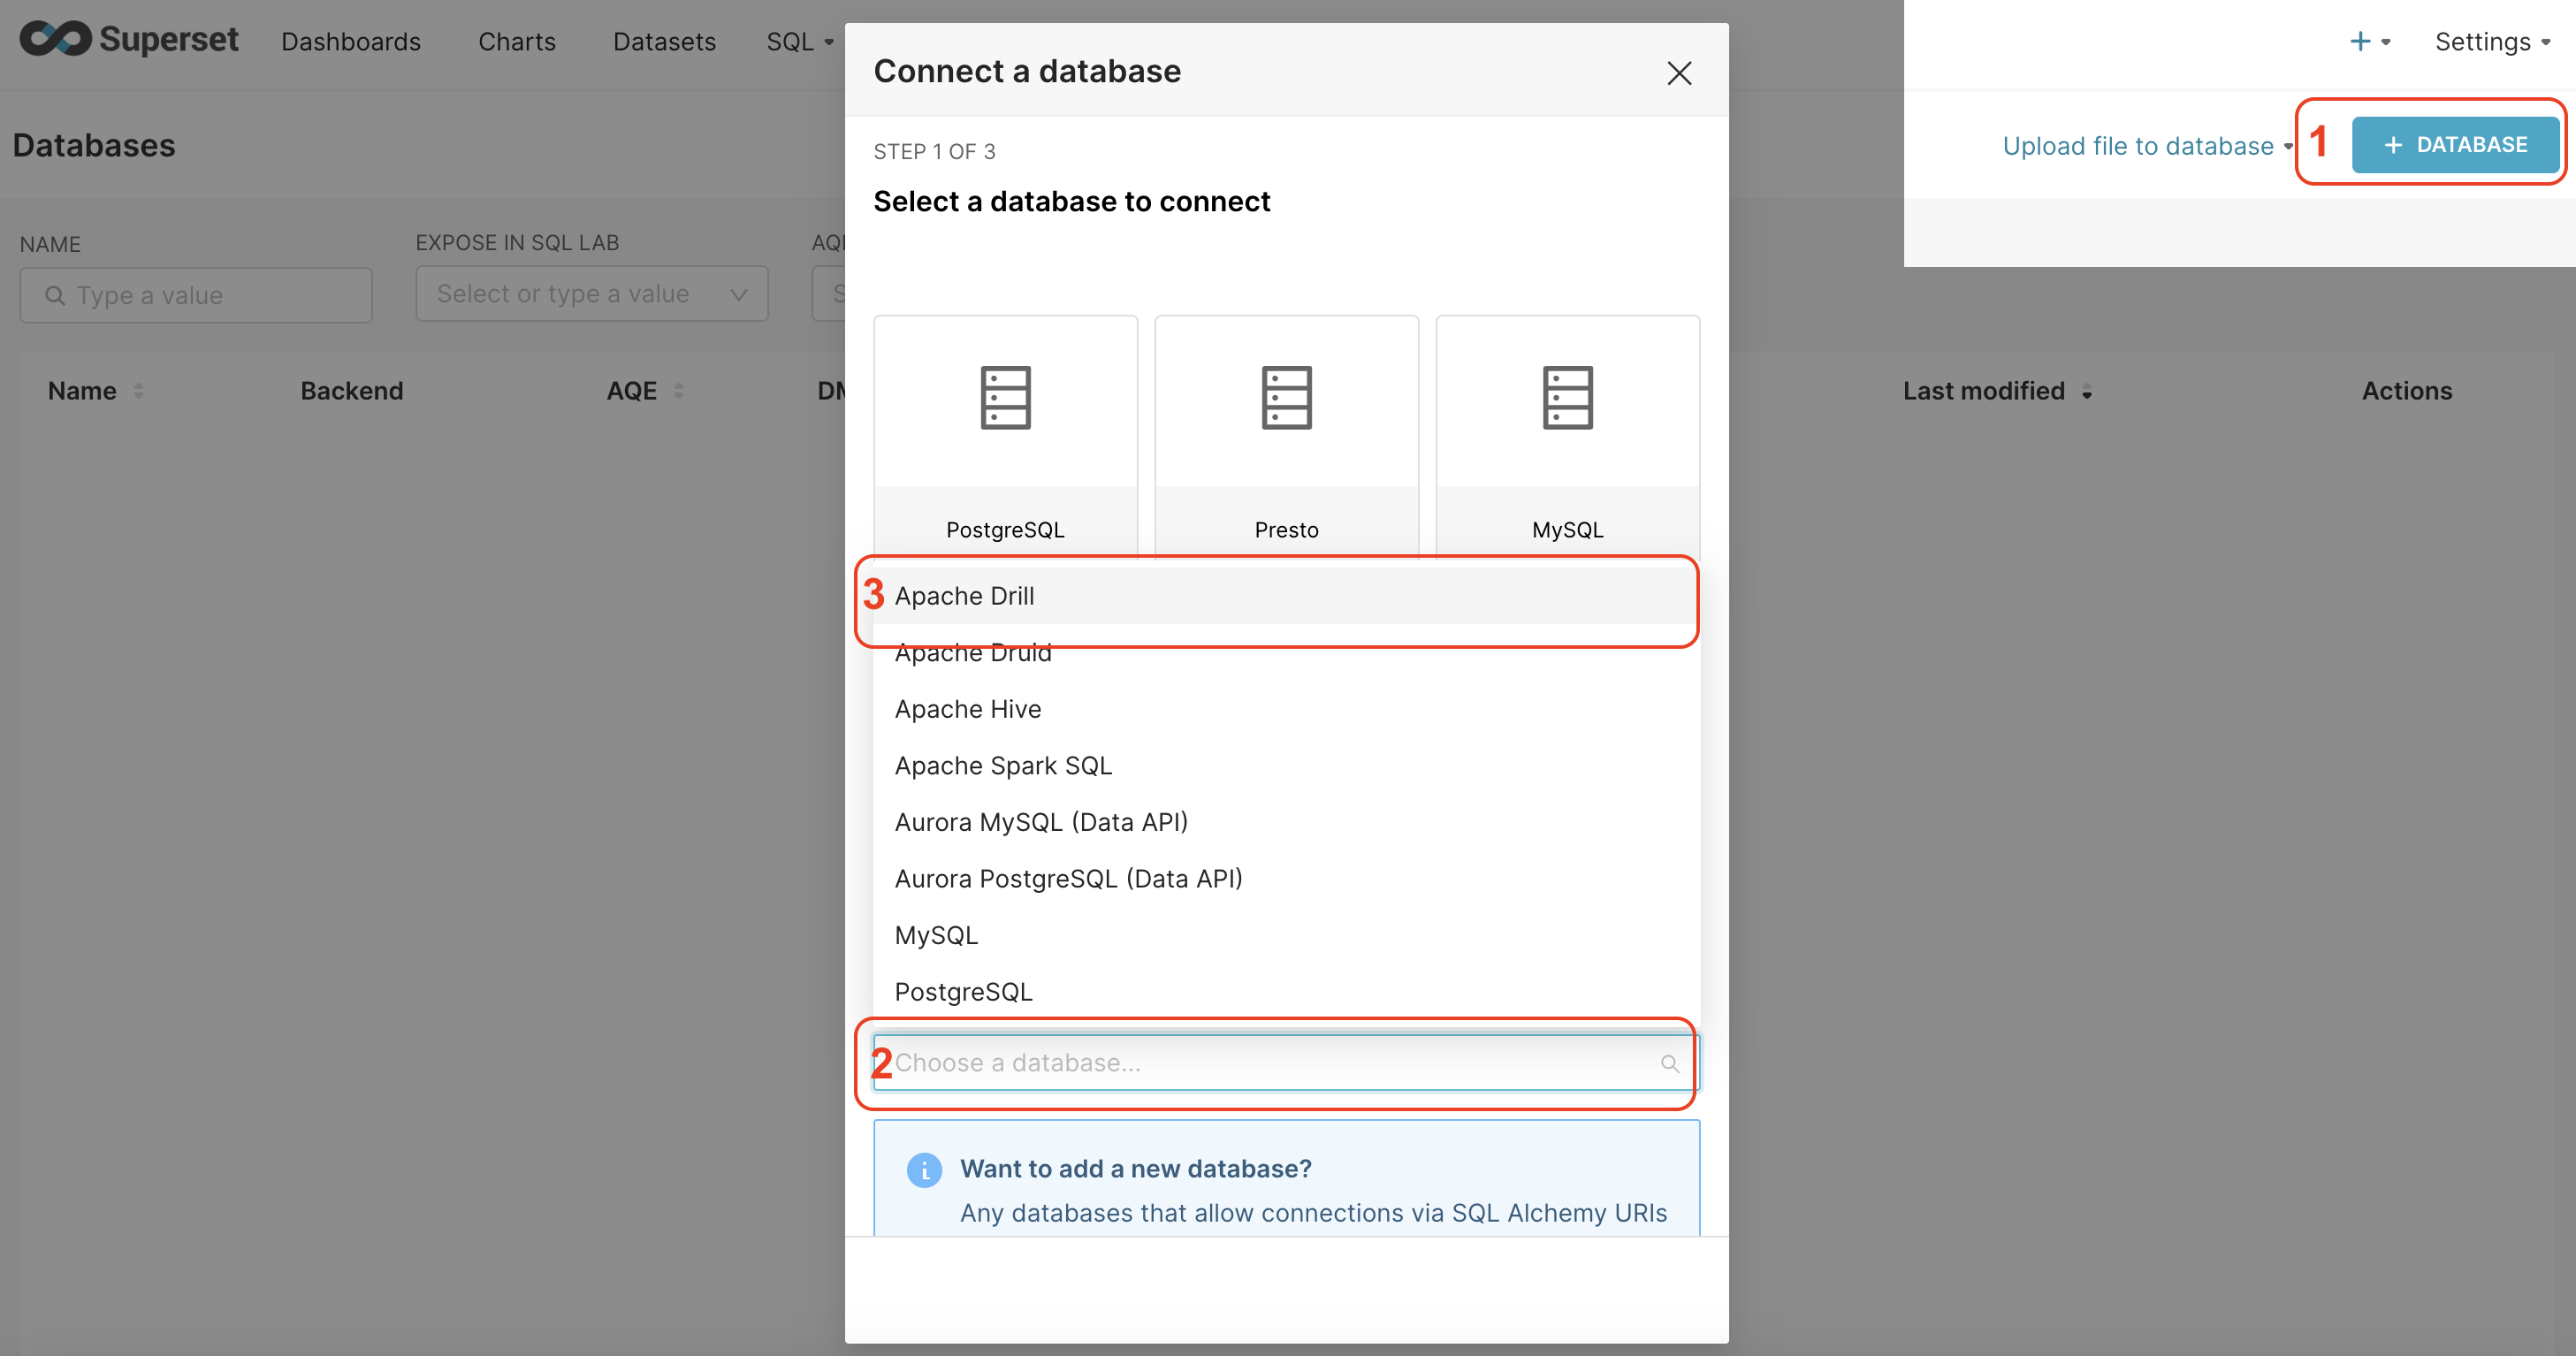 .
.Add the below SQLAlechemy URI and, then, click on Test the connection.
drill+sadrill://drill-service.magasin-drill.svc.cluster.local:8047/dfs?use_ssl=False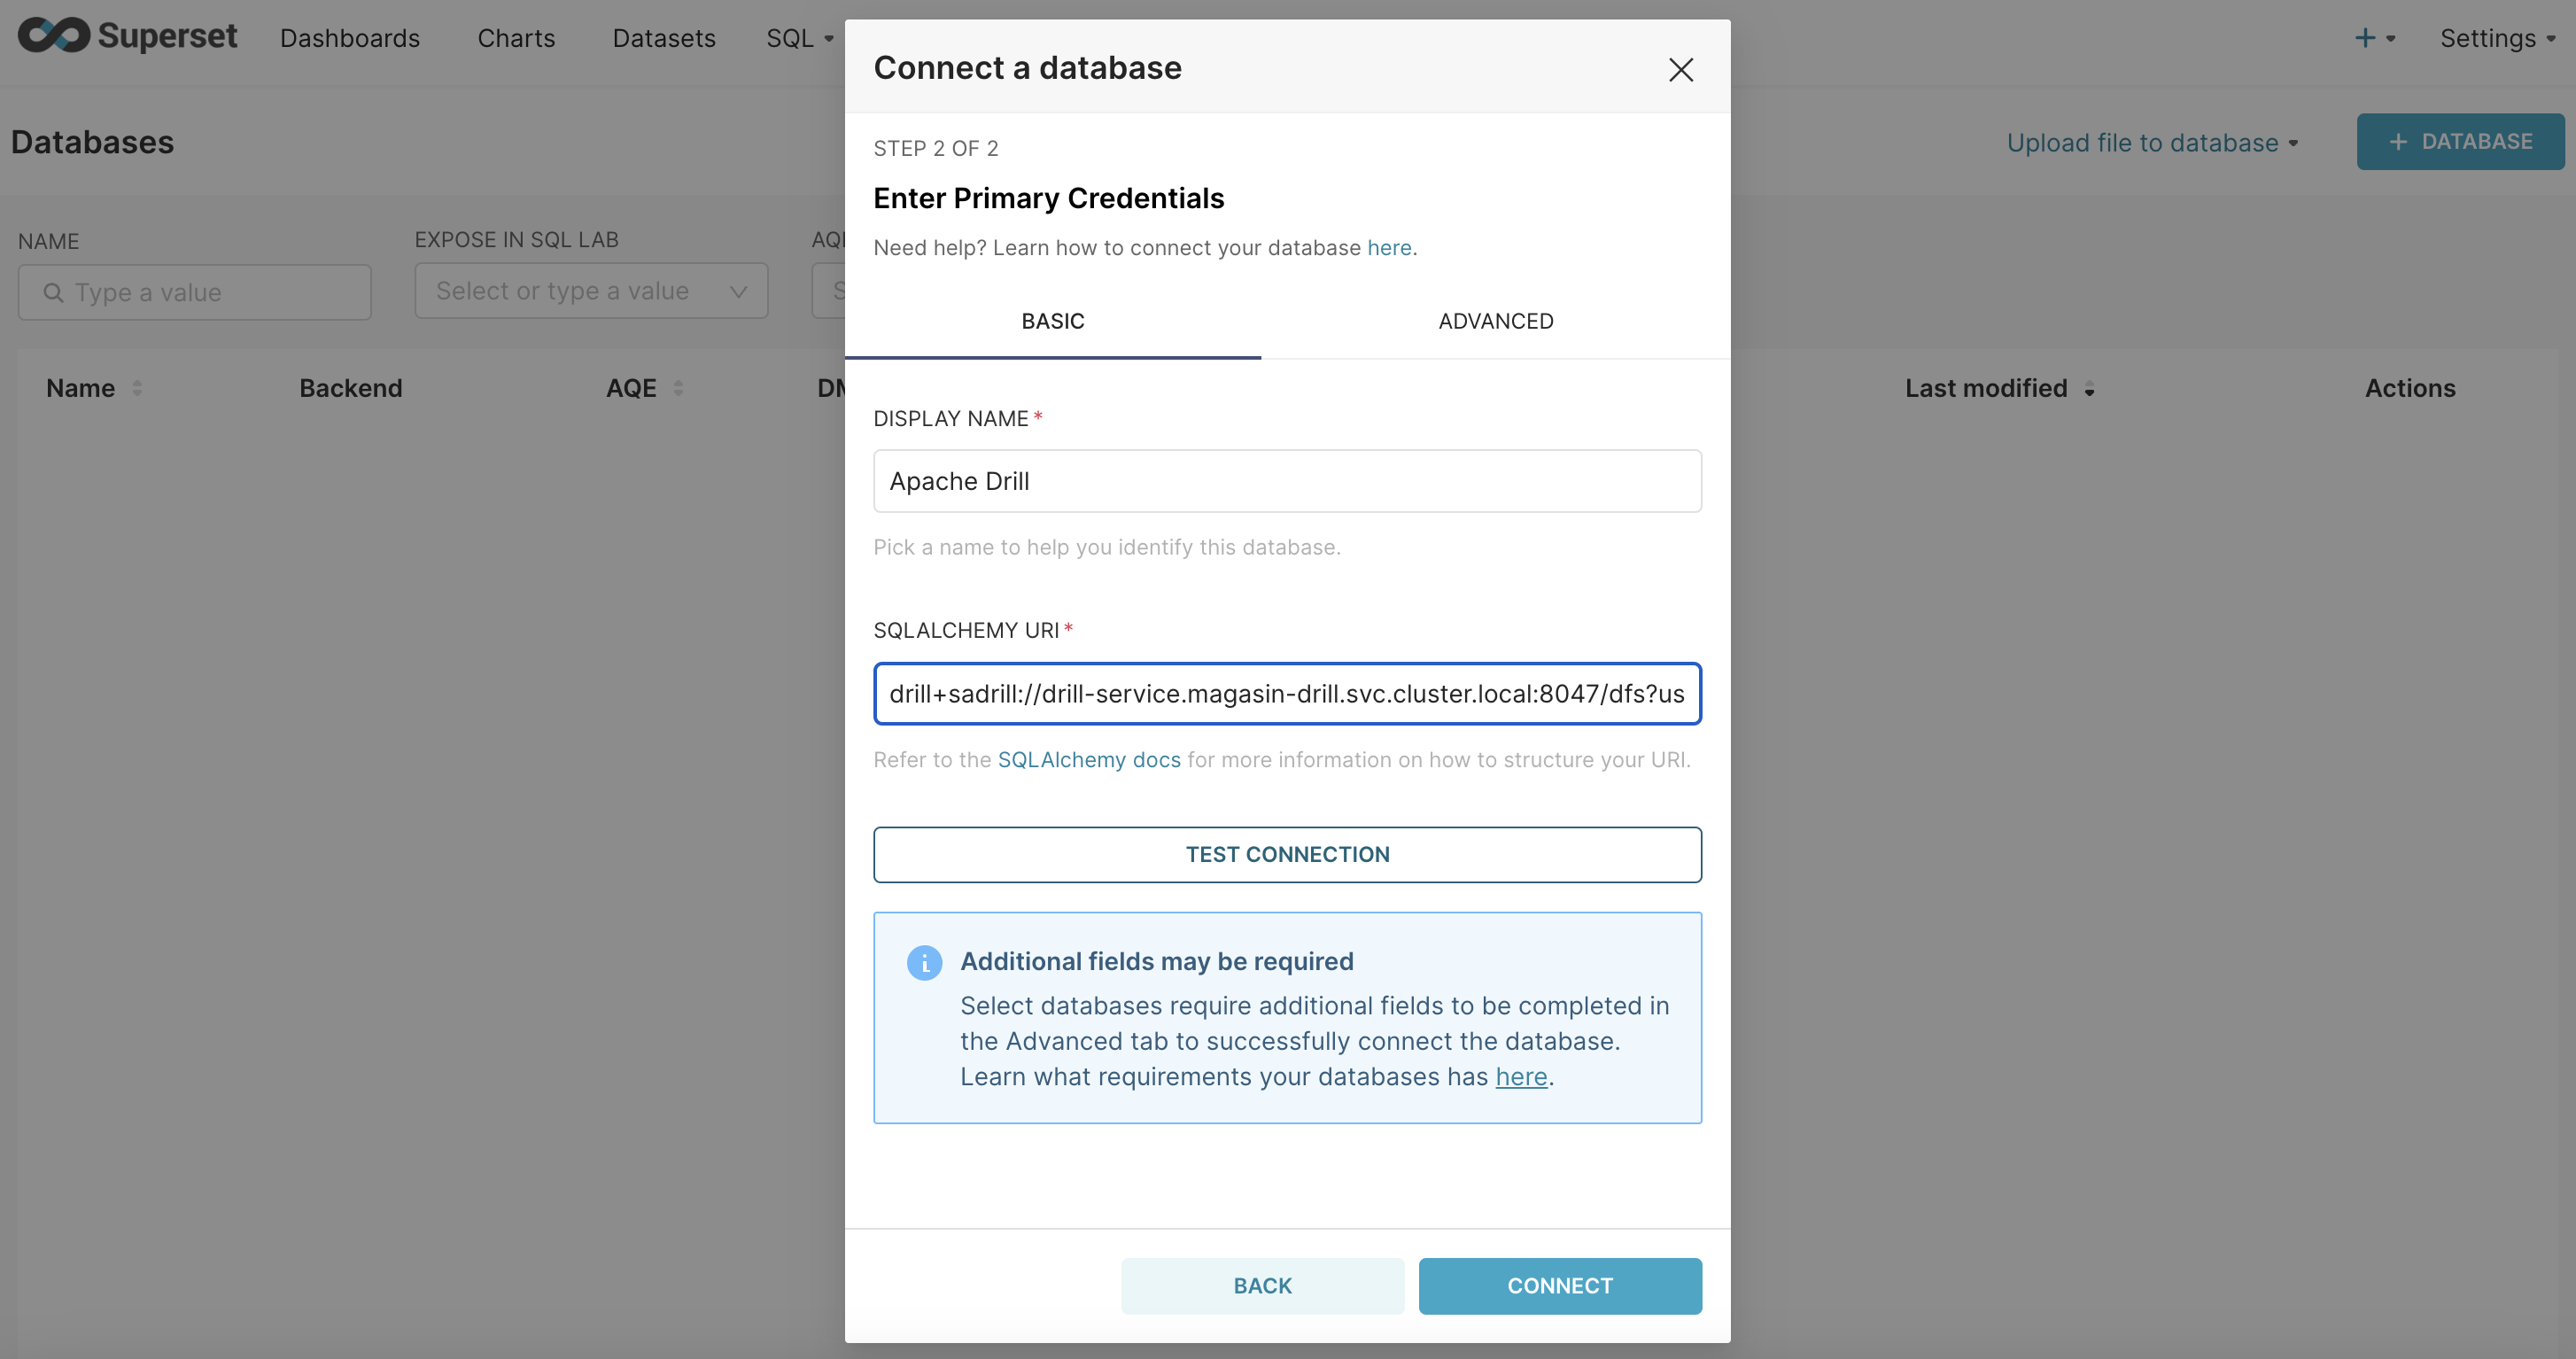
Test connection This is a connection that comes out of the box with Apache Drill. If this works, it means that superset has access to Apache Drill. Now, we will use the storage we created earlier, the
s3connection.If the connection suceeds, replace the string with the following and click on Test the connection
drill+sadrill://drill-service.magasin-drill.svc.cluster.local:8047/s3?use_ssl=False
3 Creating the Superset Dashboard
Ok, so we are in the final sprint to achieve our goal, but before we start, let’s do a quick introduction on some basic concepts of superset.
- Superset is a tool for creating dashboards. Dashboards are composed by Charts.
- A chart is a graph that displays a some data that comes from a dataset.
- A dataset is a subset of the data that can be found in a database such as a table or, in our case a parquet file.
- A database is just a collection of tables, or in our case, a folder of parquet files.
If you take a look at the top navigation bar of superset, you will see precisely those items: Dashboards, Charts and Datasets.
Now that we have some basics, let’s create our dashboard:
Click on Dashboards at the top navigation bar, and then click on the ** + Dashboard** button
 .
.Click on the + Create new chart
In the new screen, click on add dataset
 .
.Using the drop-downs, fill the data as in the image below:
- Database:
Apache Drill(the one we just created earlier) - Schema:
s3.data - Table:
deployment_countries.parquet
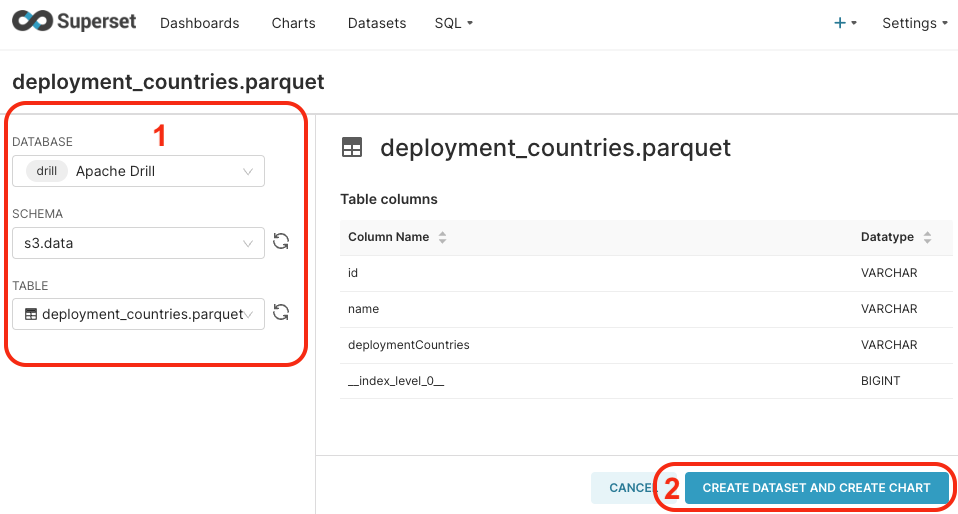 .
.- Database:
Click on Create dataset and create chart button
In the list of chart types, select the Bar chart, and then Create new chart
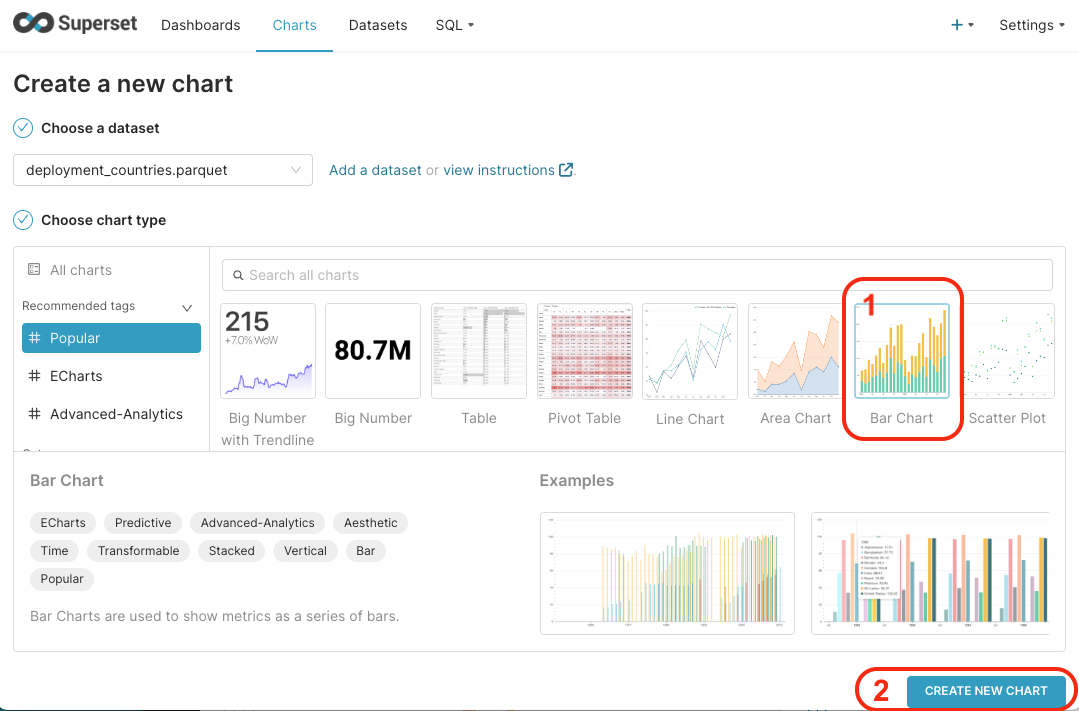 .
.Fill the data as in the image below:
- X-Axis: deploymentCountries: The main column in the X axis
- X-Axis sort by: COUNT_DISTINCT(name) - We’re goint to sort them by counting the DPGs deployed for each country
- Uncheck the X-Axis sort ascending – So we see first on the left the country with more DPGs deployed.
- Row limit: 10 – this will limit the number fo countries displayed to 10 (top ten)
Click on Update chart button.
Click on Save at the top right corner
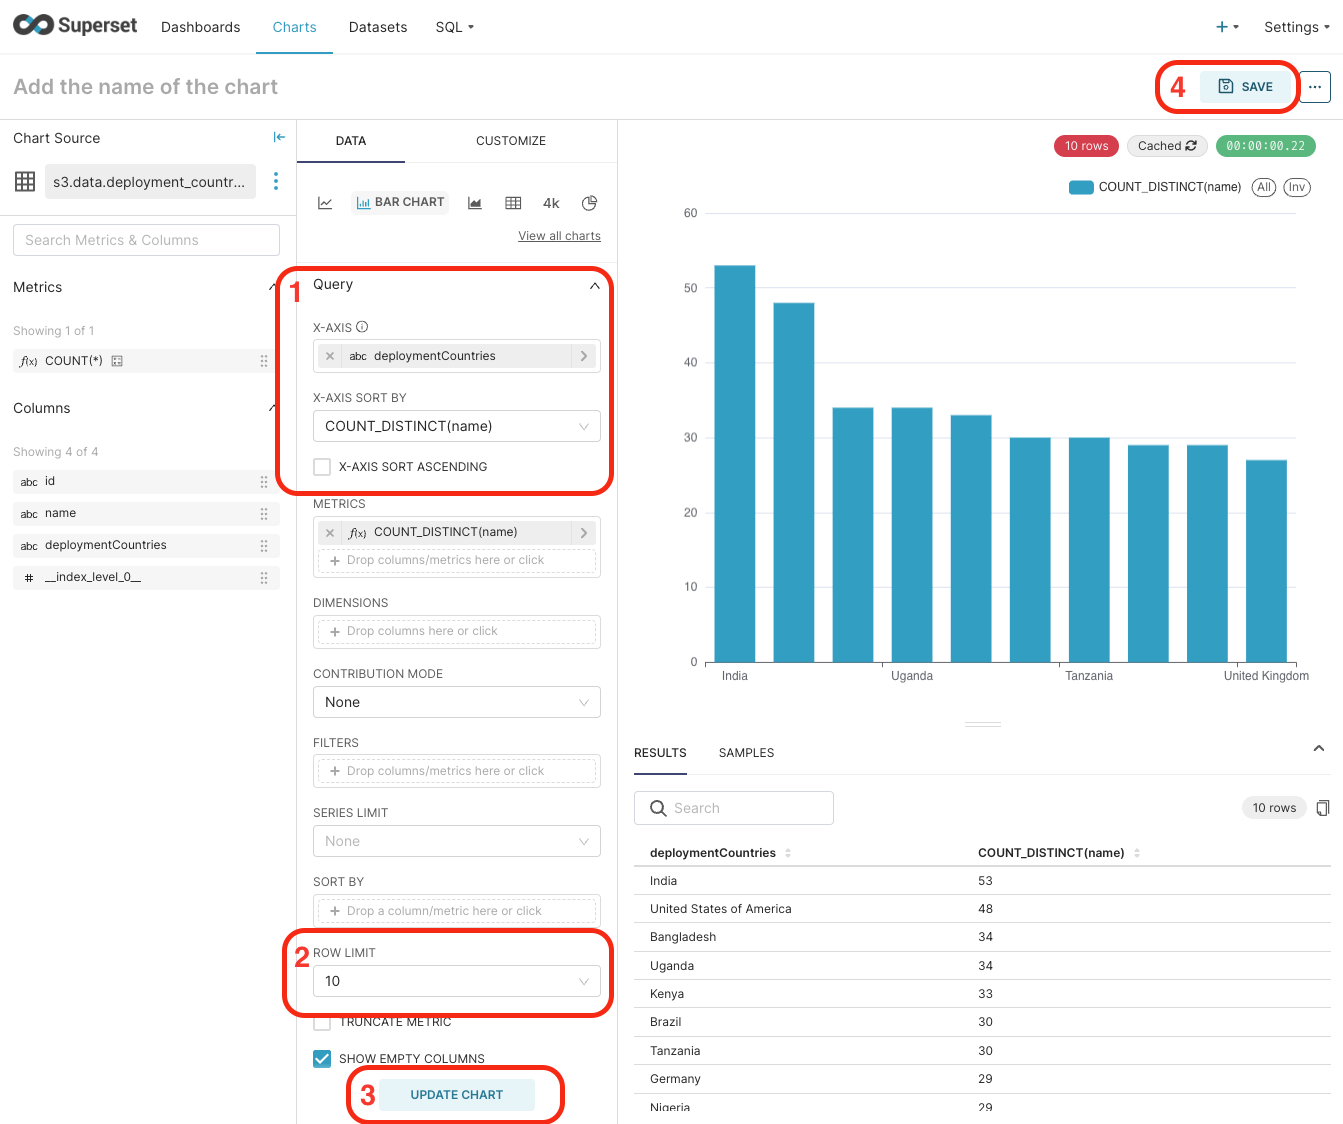 .
.In the dialog box, give it a name and click on Save & go to dashboard
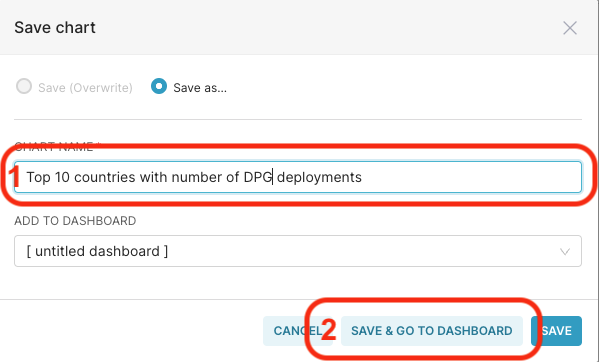 .
.
| Congratulations! You have added your first chart to your dataset. |
As an exercise you can complete the dashboard and add some more charts so it looks like this image:
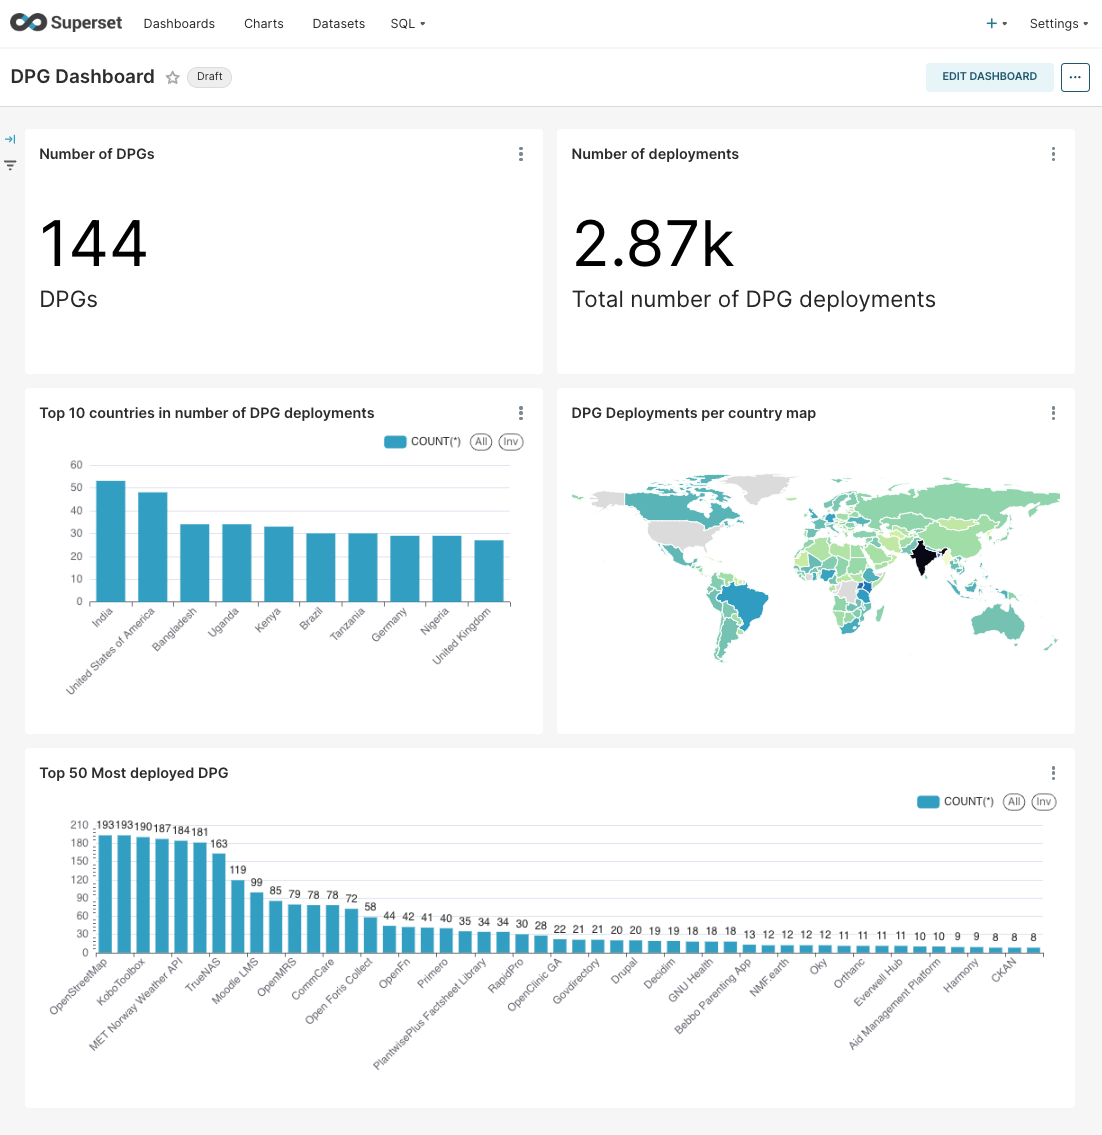
Alternatively, you can import it:
Download the file dpga-superset-dashboard.zip.
In Dashboard, import the dashboard:

steps to import the dashboard
4 Awesome!
Excellent, you have completed this getting started, in the course of it, you were able to explore a dataset, create a pipeline and present your insights in a nice dashboard.
5 What’s next
Magasin is composed by several mature open source components, mastering and setting them up to fulfill your organization requirements may require some time and practice.
End user guides. If you want to learn more about from an end user perspective on how to use some of the components of magasin.
Custom deployment and setup. This documents has useful references if you need to learn more on how to deploy magasin within your organization.